

You sit in your living room. Your phone connects to the wireless network. You open a video, and the image appears at once. So how does that data travel through the air? An invisible energy wave passes through walls to reach your device. That carrier is exactly Radio Frequency (RF) technology. In fact, it serves as the invisible physical backbone of wireless networks.
Things get even more interesting if you live in a concrete home. For example, your modem sits in the living room. You are in your bedroom, with two concrete walls in between. As a result, signal bars drop fast. But how do these waves battle walls exactly? The answer hides in electromagnetic propagation physics. This field is the cornerstone of network engineering.
I drew on over 20 years of network experience to create this guide. Indeed, each section contains real-world scenarios. My goal is not just to teach you theory. Rather, I want to give you the skill to manage your network like a pro.
We will stick to global standards, FCC rules, and ICNIRP safety limits. In addition, we will address your health concerns with scientific data. Ready? Let’s dive into the invisible layer of networks!
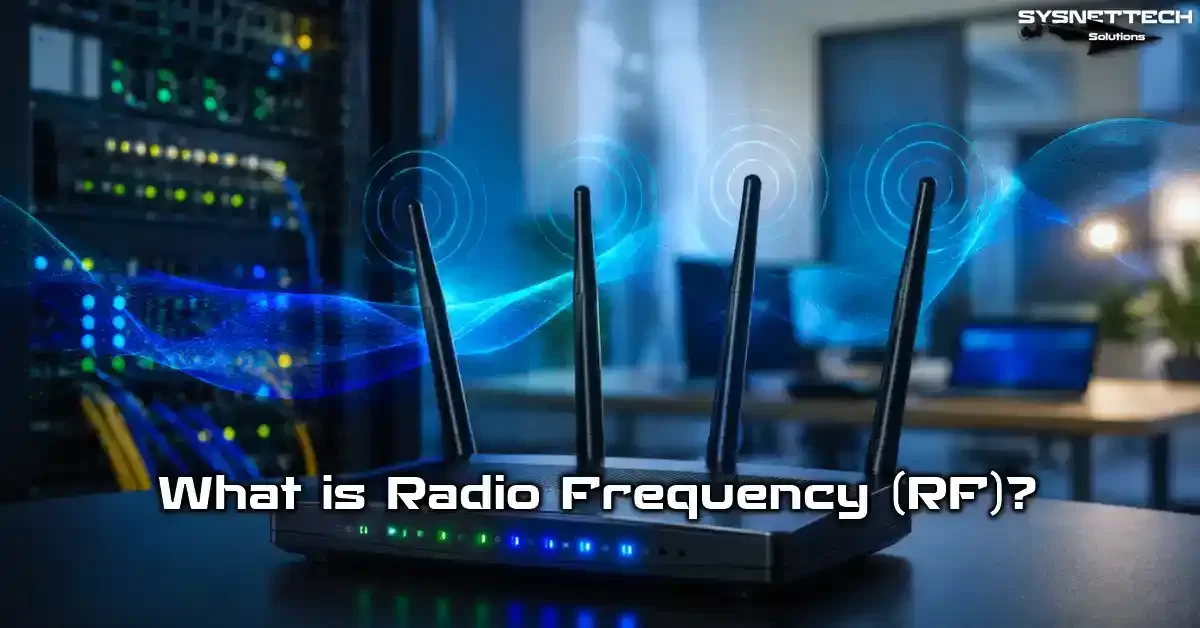
What Is Radio Frequency (RF)? The Invisible Physical Foundation of Wireless Networks
Radio Frequency comes to mind first when we talk about wireless network communication. Let’s define Radio Frequency clearly. In the simplest terms, it is the name for electromagnetic waves between 3 kHz and 300 GHz. These waves bind data onto a carrier frequency. Thus, wireless communication begins.
Think about it: visible light is also an electromagnetic wave. However, our eyes perceive that. On the other hand, we cannot see RF with our eyes. Still, it touches every moment of our network life. It appears everywhere, from access point links to base station communication.
What Is an Electromagnetic Wave? The Relationship Between Radio Frequency and the Electromagnetic Spectrum
An electromagnetic wave is, in the simplest sense, electric and magnetic fields spreading through space at the same time. In addition, an oscillator circuit creates these waves. The moment oscillation starts, energy begins to radiate into the void. As a result, these waves move at light speed. They travel at about 300 million meters per second.
The electromagnetic spectrum lists all such waves. Meanwhile, our network world mainly covers the radio and microwave regions. As you know, wavelength and frequency have an inverse relationship. So as frequency rises, wavelength shortens. Moreover, this simple physics rule forms the main basis of wireless network design.
Governments control electromagnetic spectrum management. Every country makes its own frequency allocation plan. In the US, the FCC handles this task. The FCC auctions licensed bands to operators. In addition, unlicensed bands stay open for everyone’s use.
Why Is Radio Frequency Important? The Foundations of Wireless Communication
We cannot live without wireless communication in the modern network world. Smartphones, laptops, and IoT sensors exchange data nonstop. All this traffic flows through the air on electromagnetic waves.
However, even though fiber optic cables form the backbone, the last meter stays wireless. The wireless communication infrastructure rests on three basic components:
- Transmitter: It turns the electrical signal into an electromagnetic wave. Then it sends the wave to the antenna.
- Antenna: It radiates the electromagnetic wave into space. It also directs or collects the wave.
- Receiver: It captures the weak signal from the antenna. Then demodulation recovers the original data.
Billions of devices now communicate at the same time. This vast ecosystem needs strict rules to run without issues. Organizations like IEEE set the standards.
Meanwhile, the FCC and ITU oversee fair spectrum use. RF use in network systems takes shape according to these standards.
Network Basics Physical Layer: RF’s Place in the OSI Model and IEEE 802.11 Standards
The OSI model physical layer, Layer 1, is the lowest level of network communication. At this layer, data turns into bits. It goes out for transmission as electrical signals, light pulses, or electromagnetic waves. In wireless networks, the star of this layer is exactly RF technology.
The OSI model consists of seven layers. The physical layer sits at the very bottom. Its task is to move the raw bit stream onto the medium. MAC layer communication, on the other hand, works one level higher. Moreover, the CSMA/CA protocol prevents collisions. It also manages channel access.
IEEE 802.11 standards work at this layer. Wi-Fi, which we all know, is precisely this family of standards.
We have now reached Wi-Fi 6 and Wi-Fi 7. Each new standard brings more complex modulation techniques. It also delivers higher data transmission rates.
| IEEE 802.11 Standard | Common Name | Max Data Transmission Rate | Frequency Band Used | Channel Width |
|---|---|---|---|---|
| 802.11b | Wi-Fi 1 | 11 Mbps | 2.4 GHz | 22 MHz |
| 802.11g | Wi-Fi 2 | 54 Mbps | 2.4 GHz | 20 MHz |
| 802.11n | Wi-Fi 4 | 600 Mbps | 2.4 GHz / 5 GHz | 20/40 MHz |
| 802.11ac | Wi-Fi 5 | 6.9 Gbps | 5 GHz | 20/40/80/160 MHz |
| 802.11ax | Wi-Fi 6 | 9.6 Gbps | 2.4/5/6 GHz | 20/40/80/160 MHz |
| 802.11be | Wi-Fi 7 | 46 Gbps | 2.4/5/6 GHz | Up to 320 MHz |
How Does RF Technology Work? Modulation, Data Transmission, and Signal Processing
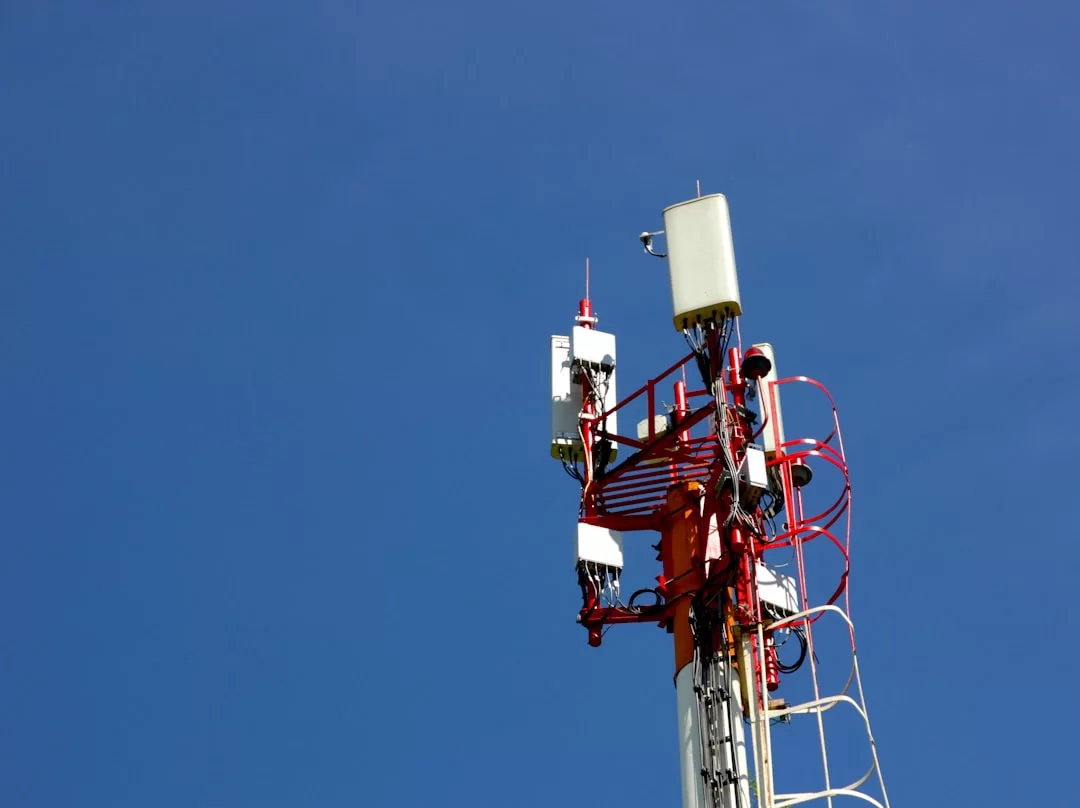
If you wonder how RF technology works, the answer lies in modulation. Modulation is the art of binding data to a carrier signal. The carrier frequency is a high-frequency wave we call the carrier. Yet, this wave alone carries no meaning.
Let’s make an analogy. Think of an empty truck. The truck itself is the carrier signal. The boxes you load are the data. In short, the modulation process is the method of placing boxes onto the truck. Later, at the destination, demodulation steps in.
Without signal modulation, wireless network communication is impossible. Voice signals have low frequency. They cannot travel far through the air. But if you bind them to a high-frequency carrier, they travel for miles. Indeed, all Wi-Fi and cellular network systems work on this principle.
In modern network devices, the modulator and demodulator merge on a single chip. Your DSL/Cable Modem at home takes on exactly this task. It turns incoming digital data into an analog RF signal. Likewise, it converts an incoming analog signal back into digital data.
What Is an RF Signal? The Relationship Between Carrier Frequency, Bandwidth, and Data Transmission Rate
Think of a carrier frequency, say 2.4 GHz. This signal oscillates in the same way nonstop. By itself, it carries no data.
Now imagine you change this wave’s amplitude or phase. At that moment, data transmission begins. Next, the speed of that change gives rise to the bandwidth concept.
Bandwidth is the space a signal occupies in the frequency spectrum. We measure it in Hertz. For example, 20 MHz bandwidth shows the signal spreads across a 20-million-hertz range. Thus, the wider the bandwidth, the higher the data transmission rate.
We use Claude Shannon’s famous theorem every day in the network world. Channel capacity is directly proportional to bandwidth. As the signal-to-noise ratio (SNR) rises, you can pack in more data. The secret of Wi-Fi 6 and Wi-Fi 7 lies exactly here.
Channel frequency overlap is the biggest enemy of wireless networks. Adjacent channel interference (ACI) is spillover from side channels. In modern networks, we find these issues with spectrum analysis. We solve them with proper channel planning.
RF Modulation Techniques: Comparing Amplitude, Frequency, Phase, QAM, and OFDM
The modulation world directly affects network performance. The most basic method is amplitude modulation. That is, the height of the carrier wave changes according to data. It is simple, but noise affects it significantly. Therefore, we rarely prefer it in network settings.
Phase modulation, on the other hand, shifts the wave’s position. It is more complex. Yet it offers a much more robust structure. Quadrature Amplitude Modulation (QAM) combines both. It changes amplitude and phase at the same time. 256-QAM can carry 8 bits in a single symbol.
| Modulation Type | Parameter Changed | Advantage | Disadvantage | Network Use |
|---|---|---|---|---|
| Amplitude Modulation | Signal amplitude | Simple circuit design | Sensitive to noise | AM radio, old systems |
| Phase Modulation | Signal phase | Robust structure | Complex receiver | Satellite communication |
| QAM Modulation | Amplitude + Phase | High data density | Needs high SNR | Wi-Fi 5/6, 4G/5G |
| OFDM Technology | Multiple sub-carriers | Tolerates multipath | Peak power issue | Wi-Fi 4/5/6/7, 5G |
OFDM technology is the star of today’s networks. It stands for orthogonal frequency-division multiplexing. It splits the carrier frequency into hundreds of sub-carriers. Each sub-carrier carries its own data. In addition, it shows superb strength against multipath propagation problems.
How Does RF Communication Work? Transceiver Architecture
The answer to how RF communication works lies in transceiver architecture. A transceiver combines the transmitter and receiver in one package. An oscillator creates the carrier frequency. The modulator encodes data onto this carrier. An amplifier boosts the signal, and the antenna broadcasts it.
On the receiver side, the process runs in reverse. The antenna captures a weak signal, and a front-end amplifier boosts it without adding noise. A mixer circuit then lowers the signal to an intermediate frequency before a demodulator recovers the original data. This whole chain unfolds in microseconds.
Modern transceiver systems are incredibly integrated. A single chip houses the entire RF front end.
Engineers calculate parameters like noise figure, sensitivity, and dynamic range with extreme precision. In systems like 5G and Wi-Fi 7, the linearity requirement becomes far more critical.
Radio Frequency Range and Spectrum Management: FCC Regulations
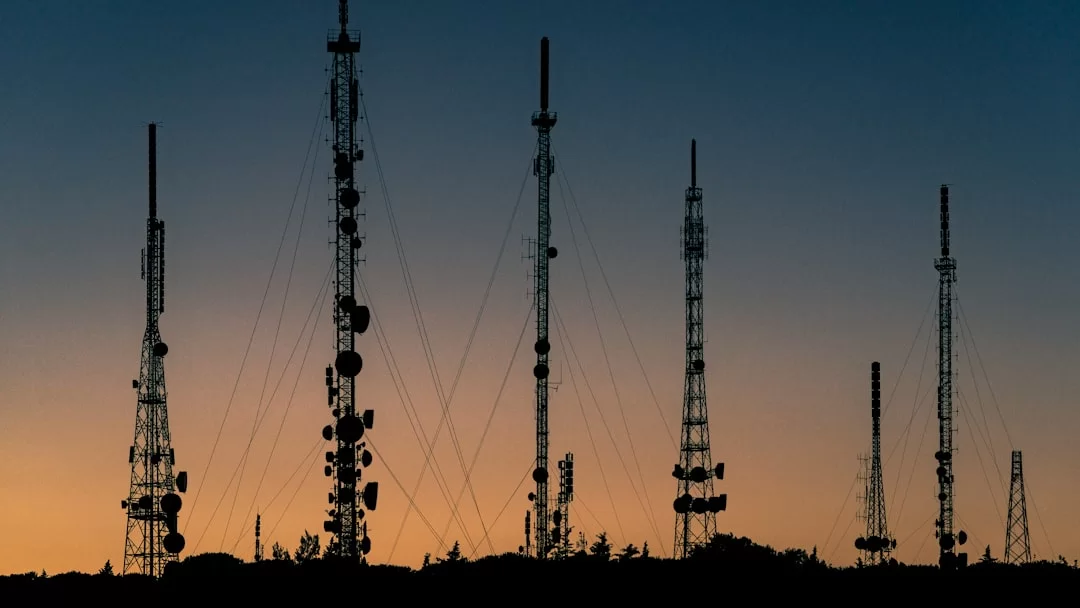
The electromagnetic spectrum is a limited natural resource. Not everyone can broadcast on any frequency they want at the same time. Total chaos would break out. No network communication would work. That is why frequency allocation is a vital government task.
In the US, the FCC handles spectrum management. The FCC stands for the Federal Communications Commission. This agency decides which frequency band gets used for what purpose. Additionally, it auctions licensed bands to operators and oversees unlicensed bands.
The telecom sector is built on these rules. Mobile operators, satellite broadcast firms, and radio stations all work within this framework. The FCC applies heavy penalties on those who break the rules.
What Is the Radio Frequency Range in Hz? Wavelength Calculation and ITU Bands
If you ask what the radio frequency range is in Hz, the answer spans 3 kHz to 300 GHz. The ITU splits this vast range into 12 main bands. Each band has its own unique propagation traits. Moreover, the wavelength formula is extremely simple.
The formula is as follows: Wavelength (meters) = Speed of light (300 million m/s) / Frequency (Hz). We use this formula nonstop in network planning. For 2.4 GHz, the wavelength is 12.5 cm. We design antennas accordingly. For 5 GHz, it is 6 cm. Fresnel zone calculations rely on this.
| ITU Band Name | Frequency Range | Wavelength | Network Application |
|---|---|---|---|
| VLF | 3-30 kHz | 100-10 km | Submarine communication |
| HF | 3-30 MHz | 100-10 m | Shortwave radio |
| VHF | 30-300 MHz | 10-1 m | FM radio, TV broadcast |
| UHF | 300-3000 MHz | 1 m-10 cm | Wi-Fi 2.4 GHz, 4G, Bluetooth |
| SHF | 3-30 GHz | 10-1 cm | Wi-Fi 5/6, 5G Sub-6 |
| EHF | 30-300 GHz | 1 cm-1 mm | 5G mmWave, 6G candidate |
In network engineering, we often calculate RF wavelength. We set antenna sizes based on wavelength. Link budget calculations also rely on wavelength. Even how much a wall weakens the signal depends on wavelength.
How Do We Manage the RF Spectrum? The Role of the FCC and ITU
Spectrum management runs on two separate levels: national and international. Internationally, the ITU serves as the UN’s expert agency.
Indeed, countries come together at periodic World Radiocommunication Conferences. As a result, they decide exactly which frequency band gets allocated to which service at these conferences.
The FCC, meanwhile, is the spectrum watchdog for the US. Accordingly, it turns global treaties into domestic law. It then publishes the frequency band allocation plan. Based on these rules, mobile operators prefer licensed bands such as 600, 700, or 1900 MHz.
Unlicensed band use holds a totally different place in the network world. The ISM band stays open to everyone. The 2.4 GHz, 5 GHz, and now 6 GHz bands fall under this scope. In this context, Wi-Fi access points and Bluetooth devices all share this band.
How Do We Allocate RF Frequencies in the US? Licensed and Unlicensed Bands
For those who want to learn how we allocate RF frequencies in the US, let me explain step by step:
- Band Identification: The FCC identifies the band it will grant usage rights for. It then publishes the technical specs.
- Auction Process: Operators submit bids. The highest bidder wins the band.
- Authorization: The winning operator signs a contract with the FCC. It then receives the FCC license document.
- Compliance and Certification: All devices must have FCC approval. Also, they undergo RF testing in labs.
- Audit: The FCC conducts periodic audits to check for limit violations.
No license is needed for unlicensed band use. Everyone is free to use the 2.4 GHz and 5 GHz ISM bands. However, transmit power (tx power) is limited. For 2.4 GHz, the max EIRP is 1 watt. Devices that exceed this limit are illegal.
Wireless Communication Technologies Using RF: Wi-Fi, Bluetooth, 5G, and IoT
Wireless network technologies have spread into every corner of our lives. When your phone alarm rings in the morning, RF waves are already on the job.
At the office, your laptop connects to a Wi-Fi access point. Meanwhile, the wireless presentation system activates during the meeting.
In IoT devices, radio frequency assumes a whole new dimension. In smart home systems, RF sensors report temperature, humidity, and motion. LPWAN technologies collect data from farm fields. Thus, protocols like LoRa and Zigbee offer long range at low power.
All this diversity meets at a single common point. They all use electromagnetic waves. They all need a carrier frequency. Their differences lie in frequency, bandwidth, modulation, and output power.
What Is the Difference Between RF and Wi-Fi? Wi-Fi Standards and the RF Bands They Use
Let’s think about the difference between RF and Wi-Fi. RF is a broad concept. It covers all radio waves. Wi-Fi, on the other hand, is a specific subset of RF technology.
In other words, it is a wireless local area network technology. It follows IEEE 802.11 standards and works in unlicensed bands.
Wi-Fi standards continue to push the network industry forward. Here are the main development stages:
- Wi-Fi 4 (802.11n): It introduced MIMO technology and offered 40 MHz channel width.
- Wi-Fi 5 (802.11ac): It added MU-MIMO and beamforming. Also, it matured the 5 GHz band.
- Wi-Fi 6 (802.11ax): It brought efficiency to a peak with OFDMA. Plus, it cracked open the door to the 6 GHz band.
- Wi-Fi 7 (802.11be): It offers 320 MHz channels, 16×16 MU-MIMO, and 46 Gbps theoretical speed.
The 6 GHz RF band is gaining more and more weight. Wi-Fi 6E and Wi-Fi 7 use this brand-new band. It offers a clean spectrum 1,200 MHz wide. Additionally, it provides massive data transmission rates with 320 MHz channel width.
Does Bluetooth Use RF? Is 5G Radio Frequency? Other Wireless Protocols
The answer to whether Bluetooth uses RF is clear: Yes. Bluetooth works in the 2.4 GHz ISM band. It uses a technique called frequency-hopping spread spectrum.
It switches channels 1,600 times per second. This way, it avoids interference. It works well over short distances with low power use.
If you ask whether 5G is radio frequency, the answer is definitely yes. 5G is fully RF-based. Sub-6 GHz bands use traditional cellular frequencies.
mmWave, on the other hand, works with 24 GHz and higher millimeter waves. Beamforming and massive MIMO antennas come into play here.
IoT communication protocols form a large ecosystem in the network world:
- Zigbee and Thread: Mesh network topology, low power, ideal for smart homes.
- LoRa and Sigfox: Long range, low data rate, fit for farming and logistics.
- NB-IoT and LTE-M: They work over cellular infrastructure in licensed bands. They need operator support.
What Is RFID Technology? Working Principle and RF Use in Smart Home Systems
RFID technology closely concerns every sector from logistics to retail. In short, this system, which stands for Radio Frequency Identification, consists of a reader and a tag.
Its working principle is quite simple: the reader sends an RF signal. The tag receives this signal. Then it sends back the data it holds to the reader.
The RFID working principle is surprisingly simple:
- The reader constantly broadcasts a carrier signal.
- The passive tag harvests energy from this signal. It powers up its circuit.
- The tag modulates its own ID number and sends it back.
- The reader receives this reply. It then moves the data to the network.
The RF transceiver module is the heart of these systems. These tiny circuits, costing a few dollars, do remarkable work. They communicate with the microcontroller. They turn incoming commands into RF signals.
RF Signal Propagation and Attenuation: Loss Mechanisms at the Physical Layer
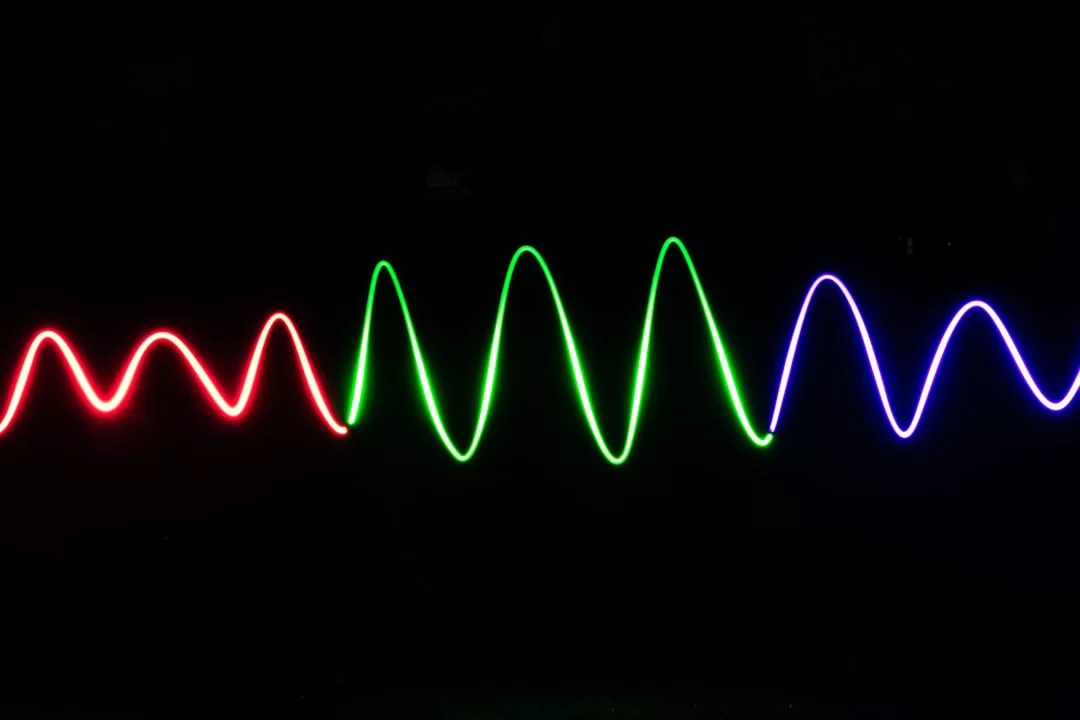
The moment an RF signal leaves the transmitter, it starts to weaken. Free space path loss is unavoidable. It is a requirement of the laws of physics.
Then walls, furniture, even the human body absorb the signal. Moreover, reflection, diffraction, and scattering change the wave’s route.
Understanding these loss mechanisms is essential for being a good network engineer. The main signal attenuation causes are:
- Distance: As the signal moves away, its power drops in inverse proportion to the square.
- Absorption: Materials like walls, glass, and wood soak up signal energy.
- Reflection: Metal surfaces bounce the signal back. They create multipath propagation.
- Diffraction: Sharp edges bend the signal. They carry it into shadow zones.
- Interference: Other devices working on the same frequency disrupt the signal.
Free Space Path Loss (FSPL) Calculation and RF Signal Attenuation Causes
Free space path loss is the loss that occurs even with no obstacles at all. We can calculate it with the Free Space Path Loss (FSPL) formula.
Loss grows as distance and frequency rise. At 2.4 GHz and 1 meter, loss is about 40 dB. At 100 meters, on the other hand, it climbs to 80 dB.
For those who want to learn how to calculate RF signal attenuation, let me write the formula. FSPL (dB) = 20 log10(d) + 20 log10(f) + 32.45. Here, d is distance in kilometers, and f is frequency in megahertz. This way, you can use a calculator and apply it with ease.
Signal attenuation does not stem from distance alone. Absorption is a major source of loss. Reflection and diffraction also weaken the signal. For this reason, signal fading and attenuation cause serious issues, mainly in office settings.
How Does the Fresnel Zone Affect Wi-Fi Performance? Diffraction and Obstacles
The question of how the Fresnel zone affects Wi-Fi performance is little-known but very critical. This zone is the ellipsoid-shaped area between the transmitter and receiver. This area must stay clear. Moreover, any obstacle that enters it creates diffraction and weakens the signal.
We calculate the first Fresnel zone radius as follows. At the midpoint of the path, the radius is at its maximum. The formula is R = 8.66 × √(d/f). At 2.4 GHz and 100 meters, the radius is about 1.8 meters. Even a tree in this zone can disrupt the signal.
Diffraction is the bending of a wave around the edge of an obstacle. Sharp edges trigger diffraction. Because of this, you can get a signal even without full line of sight.
However, diffraction loss is usually between 6-20 dB. It seriously reduces network performance.
The Relationship Between RF Wavelength and Bandwidth
People often confuse the relationship between RF wavelength and bandwidth. Wavelength is a physical quantity. It is inversely proportional to frequency. Bandwidth, on the other hand, is the range a signal occupies in frequency space. In short, the two are completely different concepts.
In terms of network performance, bandwidth is critical. More bandwidth means a higher data transmission rate. Yet, its use is not free. You occupy more spectrum, and the chance of interference rises. Thus, receiver sensitivity drops in wide bands.
In modern networks, we establish this balance with the following parameters:
- Channel width choice: 20 MHz in dense spaces, 80/160 MHz in clean spaces.
- Modulation adaptation: We lower the QAM level as SNR drops.
- MIMO configuration: We adjust the number of spatial streams based on space conditions.
RF Performance Optimization in Network Systems: Link Budget and Coverage Planning
Before you set up a wireless network, you must do a link budget calculation. Link budget shows the signal strength when it reaches the receiver. You add up all gains and subtract all losses. As a result, you find the signal level at the receiver.
This calculation is the basis of network performance. A wrong link budget leads to poor coverage or too much noise. A professional WLAN RF planning process always includes this step.
Decibel calculation is a basic skill in network engineering. You add gains and subtract losses. Since the math is logarithmic, you do not deal with large numbers. Therefore, mastering the dBm and dBi concepts is essential.
What Is an RF Link Budget? Link Budget Calculation Example
Let me explain RF link budget with a real network scenario. Say you are setting up a wireless bridge between two offices. The distance is about 0.3 miles, and the frequency is 5 GHz. Here is the step-by-step link budget calculation example:
- Transmitter Power: Access point output is 20 dBm (100 mW).
- Transmitter Antenna Gain: Directional antenna, 14 dBi. EIRP = 34 dBm (watch the FCC limit, max 30 dBm at 5 GHz).
- Free Space Path Loss: At 5 GHz and about 0.3 miles, FSPL ≈ 100 dB.
- Receiver Antenna Gain: 14 dBi.
- Received Signal: 20 + 14 – 100 + 14 = -52 dBm.
- Assessment: If the receiver sensitivity is -90 dBm, you have a 38 dB fading margin. Excellent.
Decibel Calculation: What Are dB, dBm, dBi, and Antenna Gain (dBi)?
Decibel calculation is the nightmare of new network experts. Yet, its logic is extremely simple. dB is a logarithmic ratio. It shows the gap between two power levels. dBm, on the other hand, is an absolute power unit. It takes 1 milliwatt as its reference.
A few basic rules make your job much easier:
- 3 dB increase: It means power doubles.
- 10 dB increase: It means power increases tenfold.
- 20 dB increase: It means power increases a hundredfold.
- 30 dB increase: It means power increases a thousandfold.
dBi antenna gain is just as key. dBi expresses gain relative to an isotropic antenna. The isotropic antenna is a theoretical reference. It radiates equally in all directions. A 3 dBi antenna focuses twice as much signal toward the target compared to an isotropic antenna.
| Antenna Type | Typical Gain | Beamwidth | Network Use Area |
|---|---|---|---|
| Dipole | 2.15 dBi | 360° (Horizontal) | General office coverage |
| Patch/Panel | 6-14 dBi | 60-90° | Corridor, hall coverage |
| Yagi | 10-18 dBi | 30-50° | Point-to-point bridge |
| Parabolic | 20-30 dBi | 5-15° | Long-distance backbone link |
WLAN RF Planning: RF Coverage Calculation, RSSI, and SNR Optimization
WLAN RF planning is a professional network process. First, you document the physical traits of the space. Wall types, floor plan, and furniture placement matter. Next, you simulate access point placement.
Users often ask us what the RSSI value should be. RSSI, received signal strength indicator, is the incoming signal power. In network design, we use these threshold values:
- -65 dBm and above: Excellent, any app works.
- Between -65 dBm and -75 dBm: Good, enough for data and voice.
- Between -75 dBm and -80 dBm: Borderline, data transmission may slow.
- Below -80 dBm: Poor, disconnections begin.
Knowing the signal-to-noise ratio (SNR) is also essential. SNR shows how much higher the signal is above the noise. An SNR above 25 dB is excellent. Below 10 dB is problematic. Data transmission rate drops sharply.
RF Challenges in Concrete Buildings and Industrial Networks: The US Context

The building stock in the US is diverse, yet many structures use concrete and steel. This fact directly affects wireless network performance. Concrete, rebar, and brick seriously weaken the signal. Compared to wooden or drywall structures, you face a much tougher network environment.
How does radio frequency pass through thick walls? This question becomes critical in this context. Lower frequencies have longer wavelengths. They penetrate concrete better. That is why 2.4 GHz has an edge over 5 GHz. However, modern network needs drive us toward 5 GHz and 6 GHz.
Wi-Fi signal attenuation in concrete buildings is a systematic network problem. Therefore, we apply these strategies to resolve it:
- Mesh network systems: We expand the coverage area with the main modem and satellite units.
- Extra access points: We set up wired APs in dead zones.
- Proper channel planning: We run nearby APs on different channels.
- Band steering: We steer close devices to 5 GHz and far devices to 2.4 GHz.
Signal Absorption in Walls: RF Signal Attenuation Values by Building Material (dB)
Signal absorption in walls differs for each material. The table below shows the attenuation values we use in typical network planning. Losses at 5 GHz are about 30–50% higher.
| Material Type | 2.4 GHz Loss (dB) | 5 GHz Loss (dB) | Network Design Note |
|---|---|---|---|
| Drywall | 3-4 dB | 4-6 dB | Lowest loss, office partitions |
| Brick wall | 6-8 dB | 10-14 dB | Common interior wall |
| Concrete wall | 10-15 dB | 18-25 dB | Load-bearing column, signal killer |
| AAC (Autoclaved Aerated Concrete) | 4-6 dB | 7-10 dB | Common in the US, relatively good |
| Glass (single pane) | 3-5 dB | 5-8 dB | Window, low loss |
| Steel door | 15-25 dB | 25-40 dB | Near-total blockage |
| Concrete slab | 15-20 dB | 25-35 dB | Floor transition, very hard |
This table guides you in network design. The loss between two concrete walls can reach 20-30 dB. That means the signal power drops to one-thousandth. Especially when setting the access point RF signal, you must account for these losses.
RF Rules for Modem Placement and Interference Solutions
RF rules for modem placement are vital for network performance. Here are the golden rules based on my field experience:
- Central spot: Place the modem right in the center of the home. Keep it away from walls.
- Height: Put it at least 3 feet above the floor on an open shelf.
- Away from metal objects: Mirrors, fridges, and radiators reflect or absorb the signal.
- Separate from the microwave: A running microwave oven completely disrupts the 2.4 GHz band.
- Antenna angle: Position external antennas at a 45-degree angle.
Does the number of antennas on a modem boost RF power? I can give you an interesting answer. More antennas provide an edge for MIMO and beamforming signal steering. However, total output power is limited by legal caps. Antenna count does not boost range. It boosts data transmission rate.
Spectrum analysis is essential for solving RF interference. Identify the channels nearby networks use. Switch to the 5 GHz or 6 GHz band if you can. Limiting channel width to 20 MHz reduces interference in dense settings.
RF Interference Blocking and Shielding Techniques in Industrial Networks
RF interference blocking in industrial networks is a whole separate field of expertise. In factory settings, motor drives, welding machines, and inverters create intense electromagnetic interference. This environmental RF interference can paralyze Wi-Fi and IoT communication.
The main shielding techniques we apply for industrial network safety are:
- Double-shielded coaxial cable: It protects the signal line from outside interference.
- Metal-enclosed cabinets: They place critical network gear inside a Faraday cage.
- Metal-tray cable runs: They act as a shield on long cable pulls.
- Flawless grounding: All shielding works only with proper grounding.
- Impedance matching: We keep the 50-ohm standard at all connection points.
Diversity techniques also work in industrial networks. Antenna diversity uses multiple antennas. It picks the best signal. Frequency diversity provides redundant transmission on different frequencies. These techniques boost network reliability in challenging environments.
RF and Health: Non-Ionizing Radiation Safety, SAR, and ICNIRP

Is radio frequency safe? This question concerns everyone. Cell phones, base stations, and Wi-Fi modems are constantly around us. The media publishes conflicting stories. Yet, let’s talk about the scientific facts and global network safety standards.
First, let’s make a basic distinction. Ionizing radiation and non-ionizing radiation are completely different.
X-rays and gamma rays are ionizing. They can directly harm DNA. RF waves, on the other hand, are non-ionizing. Their energy is not enough to break molecular bonds.
Is Radio Frequency Safe? Is the RF Signal Harmful to Health?
All current evidence shows that exposure under legal limits is safe. Tissue heating, which we call the thermal effect, is the only known confirmed mechanism. For this reason, limits ensure this heating stays at safe levels.
Scientists have run thousands of studies on the health effects of RF signals. The IARC classifies RF radiation as “Group 2B, possibly carcinogenic.” This classification sits in the same category as pickles and coffee. Yet, there is no clear evidence. Still, we cannot simply ignore it.
Let me be clear about the harm of radio frequency. Exposure far above legal limits heats tissues and can cause damage. However, the levels we face in daily life are far below this.
What Is the SAR Value? Limits for Smartphones and Base Stations
The SAR value comes to everyone’s mind when buying a cell phone. SAR stands for Specific Absorption Rate. It measures the RF energy absorbed per unit mass of tissue in W/kg. In other words, it shows how much energy your phone transfers to your body.
International standards have set SAR limits:
- For head and body: 1.6 W/kg (averaged over 1 gram of tissue, FCC limit).
- For whole body: 0.08 W/kg.
- General public exposure: Power density limit for base stations is about 10 W/m².
All FCC-approved devices must comply with these limits. The SAR value is printed on every phone’s box. Therefore, the agency conducts regular audits. It fines operators in case of limit violations.
Introduction to RF Engineering: Measurement Equipment, Spectrum Analysis, and Testing
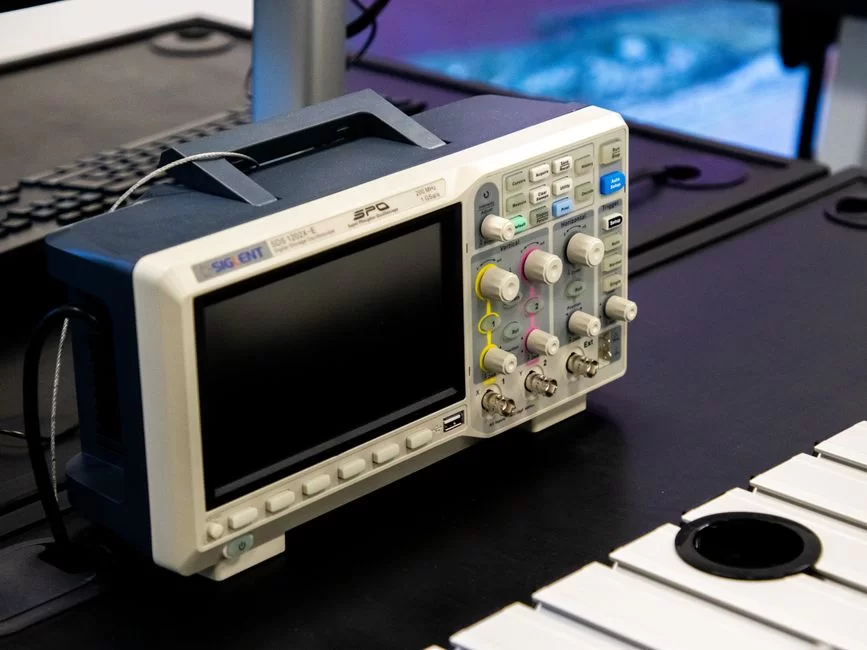
RF engineering matters for network professionals who have an interest in this field. It is the discipline that deals with the creation, transmission, and processing of electromagnetic waves. Moreover, it covers a broad area from antenna design to field measurements.
Network engineers working in this field rely on special equipment, mainly for critical measurements. Indeed, the key RF measurement devices that stand out are generally:
- Spectrum Analyzer: It displays signals in the frequency domain. It detects interference.
- Vector Network Analyzer (VNA): It measures S-parameters. It checks impedance matching.
- Signal Generator: It produces a test signal at a set frequency and power.
- Power Meter: It measures RF output power with high precision.
You cannot set up a professional network without RF testing and measurement. Access points placed blindly will cause problems. For this reason, proper measurement, planning, and optimization are essential.
How Do We Use an RF Analyzer and Perform Spectrum Analysis? Wi-Fi Channel Overlap Detection
Let’s learn the logic of an RF analyzer and jump right into a network application. A spectrum analyzer is a device that displays signals in the frequency domain. The X-axis shows frequency, and the Y-axis shows signal amplitude. In this way, you watch all RF activity in the space in real time.
We perform spectrum analysis with these steps:
- Start the device: Turn on the hardware or software-based analyzer.
- Select the frequency range: Enter 2400-2483 MHz for the 2.4 GHz band.
- Narrow the resolution bandwidth: Lower the RBW to see details.
- Turn on max hold mode: Wait a few minutes. Capture all signals.
- Mark channels: Place Wi-Fi channels on the screen as a reference.
- Spot crowded channels: Pinpoint which channels are too busy.
The method to prevent Wi-Fi channel overlap also lies here. In the 2.4 GHz band, only channels 1, 6, and 11 do not overlap. Therefore, nearby access points must be on different channels. We also spot adjacent channel interference (ACI). We solve it with channel planning.
Impedance Matching, Return Loss, and Antenna Measurement with a Vector Network Analyzer (VNA)
The vector network analyzer is the most advanced tool in RF engineering. A VNA measures the S-parameters of a circuit or antenna. The S11 parameter gives data about return loss. Thus, we assess impedance matching with this measurement.
The applications of a VNA in network systems are:
- Antenna measurement: We measure the antenna’s resonance frequency, bandwidth, and VSWR value.
- Cable testing: We check coaxial cable loss, joints, and damage detection.
- Filter characterization: We verify the cutoff frequencies of bandpass filters.
- Impedance matching check: We detect deviations from the 50-ohm standard.
Voltage Standing Wave Ratio (VSWR) is a critical parameter in radio frequency systems. For example, a 2:1 VSWR value equals about -10 dB return loss. In terms of performance, 1.5:1 is a good value, while 1.2:1 is considered excellent.
We also detect external antenna losses with a VNA. Yet, if necessary, we can calibrate with an RF attenuator.
The Future of Radio Frequency Technology: 6G, Cognitive Radio, and Dynamic Spectrum
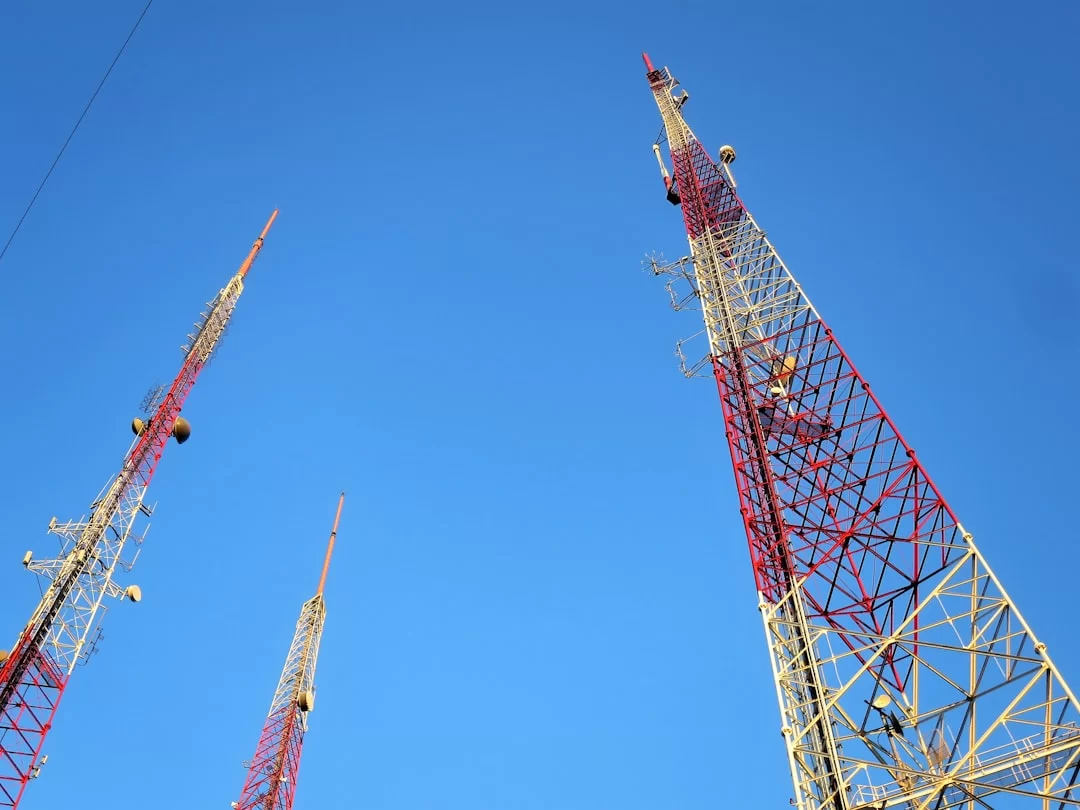
Radio frequency technology advances rapidly. Even before 5G is fully widespread, 6G research is progressing rapidly. In line with this, we expect commercial 6G network services to start in 2030.
6G does not just promise faster data transmission. Moreover, concepts like AI integration, holographic communication, and tactile internet are now under discussion.
Cognitive radio technology sits at the center of this vision. Moreover, we will no longer manage the spectrum with fixed allocations. Instead, we will use dynamic and smart methods.
Cognitive Radio and Dynamic Spectrum Access
Cognitive radio is an intelligent network solution designed to combat spectrum scarcity. Indeed, traditional systems work on fixed frequencies. So a big part of the spectrum stays idle. In contrast, cognitive radio listens to the space in a dynamic way. It spots empty frequencies. Then it instantly switches to that frequency.
Cognitive radio has two basic capabilities:
- Spectrum sensing: It analyzes signals in the space. It pinpoints empty bands.
- Dynamic decision engine: It picks the best frequency. It adjusts transmission parameters on the fly.
Because of dynamic spectrum access, network efficiency grows by leaps and bounds. Machine learning plays a key role here.
The system learns past spectrum use. It then predicts future gaps. Moreover, it switches channels in a proactive way. This makes wireless network communication more reliable.
Advanced Reading Resources for RF Hardware Engineering
- ITU-R Radio Regulations: RR5 Frequency Allocation Table Software – This is the primary reference for international spectrum management. Current global treaties and technical footnotes are collected here. It is the main source for frequency planning in hardware design.
- ICNIRP 2020 Guidelines: International Commission on Non-Ionizing Radiation Protection – These clarify the scientific safety limits for RF exposure. They cover all bands between 100 kHz and 300 GHz. They hold vital weight, mainly for 5G and Wi-Fi hardware.
- IEEE Xplore – RF and Microwave Engineering: “Is There a Moore’s Law for RF?” article – This analyzes the evolution of RF semiconductor tech in depth. It offers broad foresight for future hardware architectures. It is a must-have reference for wireless system engineers.
The 10 Most Critical Questions About Radio Frequency and Their Technical Answers
What is the frequency range of Radio Frequency in Hz?
What is the difference between RF and Wi-Fi?
Does Bluetooth use RF?
Is 5G a Radio Frequency technology?
Is the RF signal harmful to health? What are the harms of Radio Frequency?
What is the SAR value, and what should it be?
What is the difference between RF and infrared?
Why does the Wi-Fi signal weaken? How do you prevent RF signal attenuation in concrete buildings?
How do you calculate RF wavelength?
How do you calculate RF signal strength, and what should the RSSI value be?
Conclusion: Understanding Radio Frequency Means Managing Your Wireless Connection
I hope I have made you feel how deep and fascinating the world of radio frequency is. These invisible waves are actually one of the most fundamental truths of our network lives. Understanding them means managing the wireless network world.
You now know where to look when you face a problem in your network. You learned to do spectrum analysis, calculate link budget, and place antennas. So, you can assess your health concerns with scientific data. In addition, you are well-versed in FCC rules.
The first place you should look when you have network issues is the ping test results. Latency times give you an instant clue. Packet loss rate reveals physical layer problems.
The next step is to put this into practice:
- You can start by moving your modem’s spot at home.
- You can download a spectrum analyzer app and check your network space.
- If you are setting up a professional network, be sure to do a site survey.
- Do not leave the plan on paper. Verify RSSI and SNR values on-site.
LAN, WLAN, PAN (Personal Area Network) — it does not matter. All wireless networks rest on the same physical principles. Pinpoint your bandwidth needs correctly. Make your frequency choice based on the space.
When needed, do not hesitate to invest in a router and access point. Quality network equipment always pays for itself.
My final word is this: Radio frequency technology never stops evolving. Wi-Fi 7, 6G, and cognitive radio are on the horizon. Keep investing in this field, and never stop learning!

Be the first to share your comment